In this blog post we will plot near realtime Lidar Measurements on a browser. We will use a Raspberry Pi connected to the TF Mini+ Lidar from Benewake. At the end post of this you’ll be able to see a Realtime Graph of Lidar measurements. Each measurement is in centimeters and has an associated strength reading.
End Result
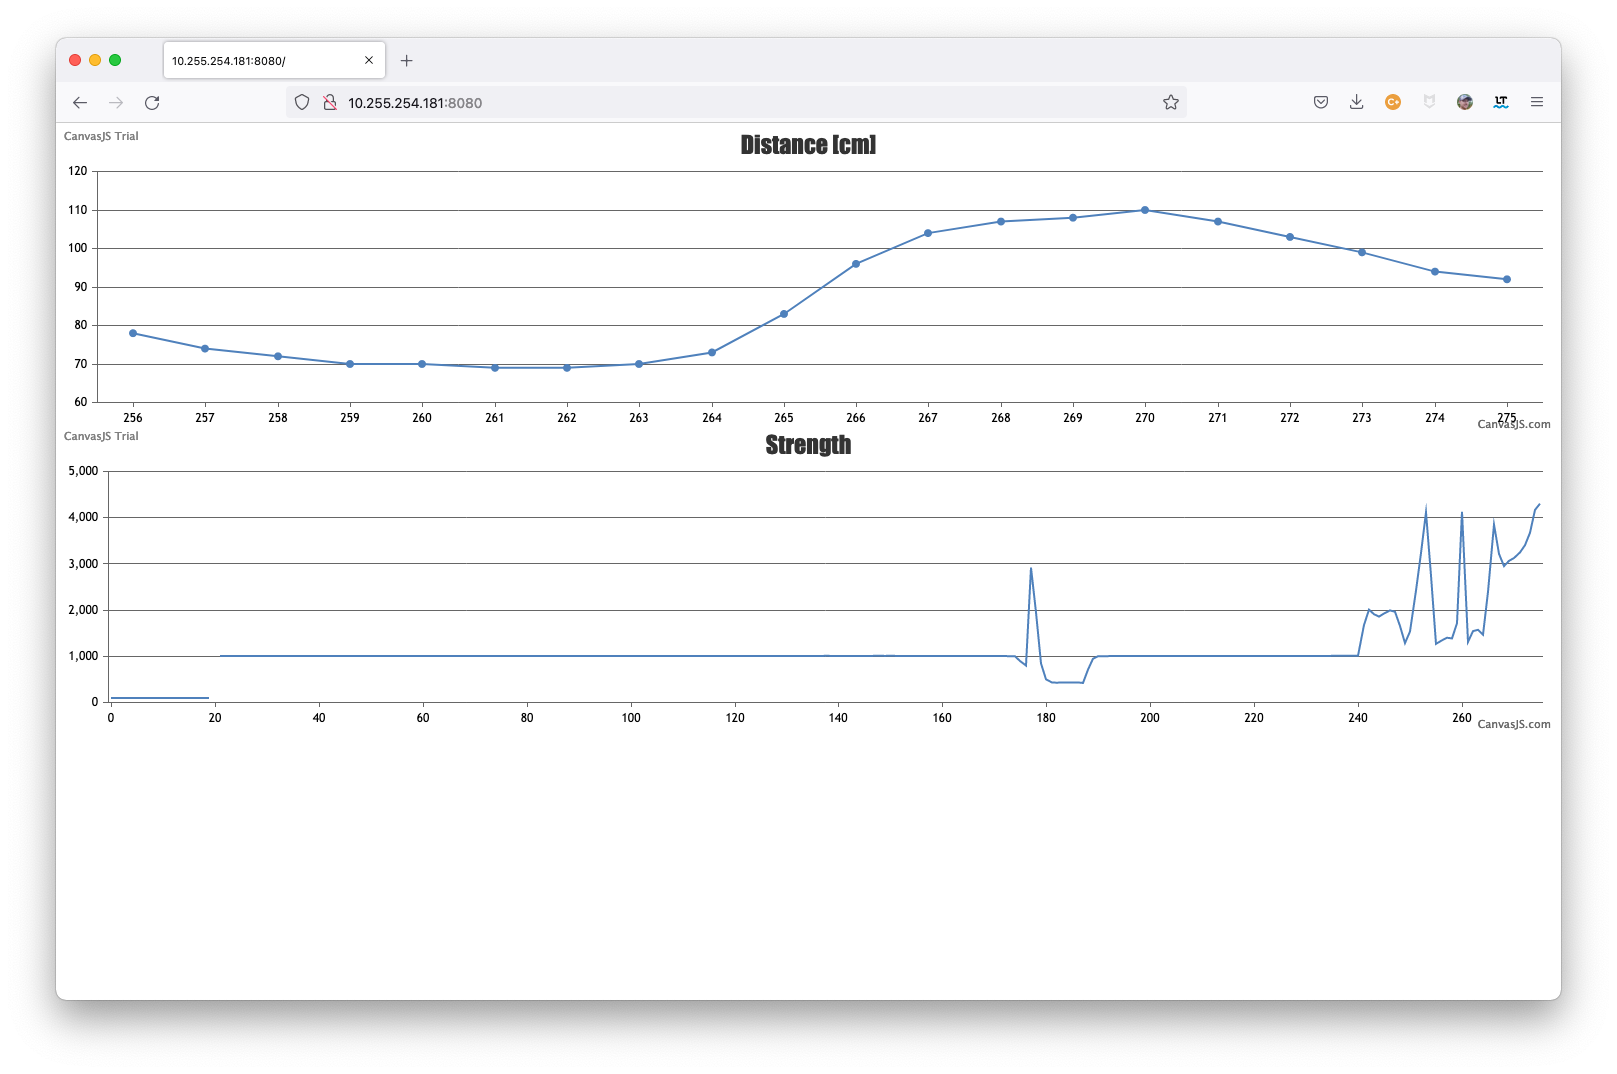
Here is what the graph looks like on a browser. There is both a distance and strength measurement on a plot. On the y-axis for distance we have a measurement in centimeters. The signal strength is the second graph. The strength is a 16-bit value.
We can see a subject being measured from 70-100 cm away.
Video of the Lidar in Action
Here is a video of me walking back and forth in front of the Lidar. The readings of 20-120 cm are quite accurate. In fact using a yardstick the Lidar Measurements seem accurate to the centimeter or so. The Lidar is reflecting off myself wearing clothing which gives us a swag for what the signal strength is.
Diagram
The overall diagram is a bit complicated, but this allows for flexibility. Let me explain.
I’m using two Raspberry Pi Boards: a Zero W and a Pi 4. The reason is I’d like to have the Zero W take the Lidar measurements and send them over the same WiFi network to the Pi 4 where the NodeJS server is. This way I can use the cheaper Zero W in a remote location that sends to some more expensive hardware elsewhere.
Just as easily you can have the Lidar and the NodeJS on the same Zero W or the Pi 4 or whatever any other Pi version. This is because the tfmini daemon just takes Lidar measurements and sends them to an IP address over UDP. That address can be on the same host or to a server that’s not a Raspberry Pi at all. Send it out over the internet if you want to a server in the cloud.

Hardware Used
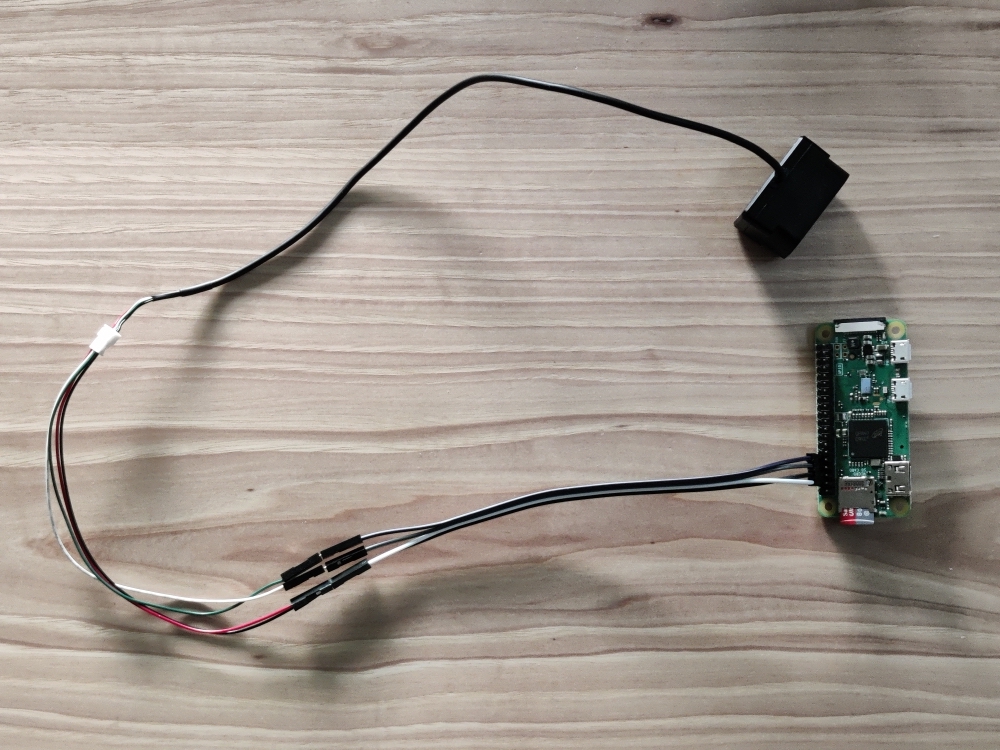
For an explanation of this diagram we have the following hardware:
- The TF Mini+ Lidar attached to the Raspberry Pi Zero W
- A Raspberry Pi 4 running Node JS
- Another computer with a browser pointed to the IP Address that NodeJS is listening on. See very closely in the screen shot above it is
10.255.254.181:8080.
Software Used
We have the following software:
- The tfmini which takes Lidar measurements over the UART and sends them out to server listening on UDP.
- A NodeJS server that is listening on UDP and on HTTP. This server takes a UDP datagrams and sends them out websockets.
- A browser to load up the page that NodeJS is listening on and connect to the websocket.
Lidar Setup
First follow the tfmini daemon setup to get the tfmini wired in, software configured and installed.
Once installed, we can send Lidar frames to the NodeJS server over UDP using the following command:
$ tfmini --set-update-rate 5 --socket-udp 10.255.254.181:8081 -p
update rate to 5Hz success
LiDAR output enabled
Distance: 28 Strength: 2740 Good Frames: 00000025 Bad Frames: 00000000
This gives good update information. The IP address of 10.255.254.193 is the address of my NodeJS server that is listening on port 8081 for UDP datagrams.
From here the -p option makes it poll so it’s listening for new Lidar data coming in and the --set-update-rate 5 set the Lidar to send data 5 times per second. This rate is variable but I’ve found 4-6 are optimal rates.
NodeJS Setup
The NodeJS setup is simple. Follow this github repository. Below is the main part with the NodeJS server code.
Run the server by typing node server.js. Then load a browser and point it to the IP address of the server on port 8080 to see the graph.
var static = require('node-static');
var http = require('http');
var fs = require('fs');

var file = new(static.Server)(__dirname);

const server = http.createServer(function (req, res) {
  file.serve(req, res);
}).listen(8080);

const { Server } = require("socket.io");
const io = new Server(server);

io.on('connection', function (socket) {
  socket.emit('message', 'connected');
  console.log("socket connected");
});

var dgram = require('dgram');

//Initialize a UDP server
var srv = dgram.createSocket("udp4");
srv.on("message", function (msg, rinfo) {
  //console.log("udp datagram from " + rinfo.address + ":" + rinfo.port);
  var buf = Buffer.from(msg);
  var message = {
    distance_cm: buf.readInt16LE(2),
    strength: buf.readInt16LE(4)
  }
  io.emit('message', message);
});

srv.on("connect", function (msg, rinfo) {
  console.log("connection");
});

srv.on("listening", function () {
  var address = srv.address();
  console.log("listening on udp:" + address.address + ":" + address.port);
});

srv.on('error', function (err) {
  console.error(err);
  process.exit(0);
});

srv.bind(8081);
Where to go from here?
This example is quite basic but here are some potential improvements:
- Run the
tfminiprogram as a daemon. This requires very minimal updates to thesystemdscripts already provided in the tfmini repo. With the above we require a terminal open and running. If this terminal is closed no measurements are sent. Asystemdservice that runs adaemonalleviates this. - Logic to detect movement. We can take the derivative of the distance to detect differences.
- Alerts when a distance is reached. Once something is in the path, say under a threshold we can send alerts.
- Smart logic for power. The
tfminiprogram could be modified to sleep and not always be polling.